Problem 122: Bird Watching
Problem made by Lockheed Martin, is CodeQuest 2019 Problem 20
This problem has a difficulty of 70
Problem Background
Machine learning (ML) is a fancy type of artificial intelligence algorithm that uses patterns of previously-seen data to make predictions about new data that’s never been seen before. ML algorithms can be very complex and can be used to solve extremely difficult problems; for example, neural networks simulate how individual cells in a real, living brain function. However, some are simple, straight-forward, and are great at solving pattern-related problems. In this problem, you’ll need to create a machine learning system of your own!
You are working with the local park service to sort through pictures they’ve taken of birds recently. They want to be able to use these pictures to track the populations of certain species, but they have a very large number of photos and need to find a way to organize them. They decide to follow the practice of animal taxonomy and organize them by the family of the bird pictured in the photo. With the number of photos to sort through, they need an automated means of organizing the photos this way.
Your colleague suggests that you use measurements of the birds obtained from the photographs to predict a bird’s taxonomic family. She retrieves a set of information about a long list of bird species and shows you there is an apparent correlation between certain measurements and a bird’s family:
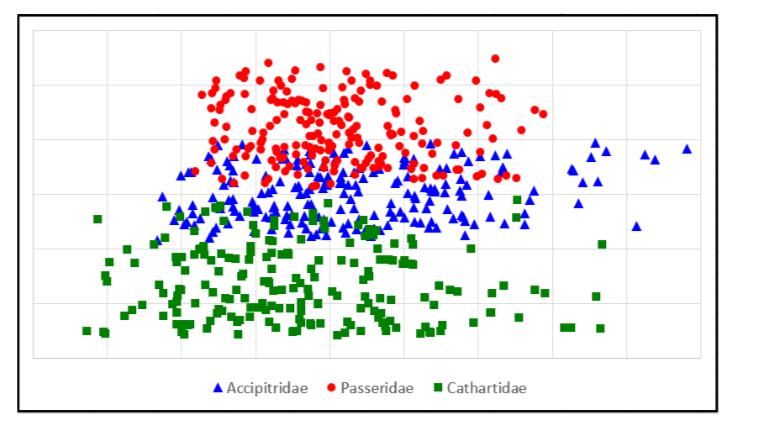
This graph is called a t-SNE embedding, a type of graph that converts multiple measurements (in this case four) into a two-dimensional coordinate. Each point is color- coded based on the bird’s taxonomic family. As your colleague points out, most of the colors are grouped together, giving her hypothesis that a pattern can be identified more weight. Her suggestion is to determine how “far away” an unknown bird is from these known measurements, and use that to make a reasonable prediction of the unknown bird’s family.
Problem Description
Your colleague’s idea is called a k-Nearest Neighbor (kNN) algorithm. This will predict an unknown bird’s family based upon available taxonomic data and the measurements of the unknown bird. A kNN algorithm works by calculating the “distance” between an unknown datum point and each known data point. The k known data points closest to the unknown datum are then used to “vote” for the final decision.
In this problem, your algorithm should calculate the distance between the given unknown data point and all known data points. Once all distances have been calculated, count how many times each family of birds appears within the K closest points. This is the “voting” process mentioned before. Whichever family gets the most votes is selected as the family for the unknown bird.
In general, the value of K for this algorithm must be an integer; when there are only two possible answers, this is usually an odd integer, to avoid the likelihood of ties during the voting process. Here we have three possible answers, so ties will be possible. To address this, start with an initial value of K = 5 for all unknown birds. In the event there is a tie, increment K by 1 until the tie is broken; reset K to 5 for the next unknown bird.
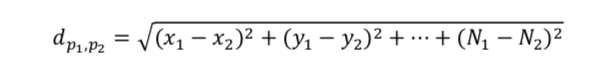
The formula for calculating distance between N-dimensional points is as follows:
A line containing two positive integers separated by spaces: X, representing the number of known birds, and Y, representing the number of unknown birds.
A total of X lines containing information about known birds. Each line will contain the following values, separated by spaces:
Each bird will be represented by four points of data in addition to its family - its length, body width, wingspan, and the angle of its wings relative to its body.
Sample Input
The first line of your program’s input, received from the file named above, will contain a positive integer representing the number of test cases. Each test case will include the following lines of input:
o One of the words “Accipitridae”, “Passeridae”, or “Cathartidae”, representing the bird’s taxonomic family
o A decimal number representing the bird’s length in inches.
o A decimal number representing the bird’s body width in inches. o A decimal number representing the bird’s wingspan in inches.
o A decimal number representing the bird’s wing angle in degrees.
• A total of Y lines containing information about unknown birds in your available photographs. Each line will contain the following value, separated by spaces:
o A decimal number representing the bird’s length in inches.
o A decimal number representing the bird’s body width in inches. o A decimal number representing the bird’s wingspan in inches.
o A decimal number representing the bird’s wing angle in degrees.
1
15 3
Accipitridae 12.30 7.03 25.32 88.59
Accipitridae 21.38 7.57 22.18 88.71
Passeridae 16.57 7.05 25.88 89.27
Passeridae 13.34 6.24 21.37 88.95
Passeridae 15.75 6.58 22.16 89.35
Accipitridae 15.16 5.17 22.43 89.04
Cathartidae 18.61 6.68 23.37 88.83
Accipitridae 21.32 8.14 20.09 88.55
Cathartidae 18.35 7.01 20.64 88.14
Cathartidae 13.61 5.33 23.72 90.21
Cathartidae 16.88 6.63 24.59 88.48
Accipitridae 15.63 8.66 23.19 88.51
Passeridae 17.29 7.62 26.46 89.31
Passeridae 20.03 8.68 20.97 89.05
Cathartidae 19.19 7.74 22.31 88.09
19.37 15.35 17.30 15.28
12.76 21.96 14.41 16.84
20.33 15.51 16.29 17.10
Sample Output
For each test case, your program must print the predicted taxonomic family for each unknown bird, one per line.
Accipitridae
Cathartidae
Accipitridae